
How This Works
Overview
Sport Sentiment attempts to measure the degree of positivity or negativity expressed in sports conversations, more specifically in comments from leagues' and individual teams' subreddits (forums) on Reddit. The model that takes raw text and outputs a positivity/negativity score was trained and validated to >80% accuracy on 1.6 million tweets. Sentiment analysis has been shown to be highly transferable, so training on tweets and predicting on Reddit comments should not see a huge drop in performance, although there is no way to measure this currently. Data has only been collected since July 2020, but early results do show a strong association between fanbases' sentiment and win-loss results, suggesting the validity of this model and its usefulness as an approximate litmus test for fans' mood.
Solely using Reddit comments may limit the scope of analysis to less casual, more "nerdy" fans, but it has the advantages of:
- Subreddits classified by team (as opposed to Twitter)
- A free and fast API for collecting data, and a demographic slowly shifting toward that of the larger sports fan population due to the site's growth
- Similar rituals across subreddits (pregame/in-game/postgame threads) that make comparing two teams in the same league a worthwhile exercise
To sum up, I hope Sport Sentiment can be a fun diversion, showcasing the strength of machine learning (ML) in understanding internet language, and providing a way to visualize teams' highs and lows over the course of an unusual 2020 season. I encourage you to add to your experience by cross-referencing movements in team graphs with news from specific days (e.g. observe the increase in negativity for just about every MLB team when it looked like the season would be cancelled after the Marlins outbreak on July 27). Look out for updates on this page in the future.
How Does the Model Work?
Sport Sentiment uses a neural network to generate scores corresponding roughly to how positive or negative the mood of a comment is. This is an example of a natural language processing technique known as sentiment analysis.
Unlike models for precise tasks such as fraud detection, strong sentiment analysis models may have an accuracy of just 70-80%, simply because sentiment is subjective : even humans only agree with one another on 80% of examples. Various model types can perform sentiment analysis with reliable accuracy, ranging from linear regression to ML techniques like naive bayes. I used deep learning, in particular a recurrent neural network (RNN), because:
- With sufficient data, neural networks can model complex interactions between different inputs (words in this case) without much more than raw examples. Other ML algorithms depend more on manual Feature Engineering, which is time consuming and depends on extra domain knowledge. With vast enough quantities of relevant data, neural nets can tackle end-to-end problems that normally require multiple stages of specially designed algorithms, such as speech recognition.
- Note: the model doesn't really "understand" the meanings of words in the way humans do. "Neural" Nets conjure images of the human brain, but the human brain is infinitely more complex. There's also no reason to think the human brain is the optimal blueprint for all ML; take the failure of classical contraptions that focused on resembling birds, who happen to be able to fly, rather than just focusing on flying.
- RNNs are designed to "memorize" words earlier in a comment and apply that stored contextual knowledge to words near the end of it.
- Take the sentence, "The Nationals rallied, but Seattle's dominant bullpen regained its footing to hold on to the win." Other types of models may infger "Seattle" is referring to the city as a whole, but an RNN is well built to decipher that it's referring to the Mariners because it stores context supplied by "Nationals" for later use.
- RNNs are also known as sequence models and can be applied to other sequenced data besides strings of text such as audio.
- This model is a GRU RNN, which stands for gated recurrent unit. This means it's better equipped to "memorize" information for longer distances within a sentence than basic RNNs. LSTMs are another alternative with a similar goal, but they are generally slower to train.
- RNNs have additional potential in the form of bidirectional variants, which can use words later in a comment to contextualize words near the beginning by reading backward, on top of the normal forward behavior.
- Take the sentence "Teddy lived in Oyster Bay, while Franklin lived in Hyde Park." The normal, forward model sees that "Franklin" probably means FDR because it remembers also seeing "Teddy", but it wouldn't know if "Teddy" was the president or the stuffed animal because it can't iterate backward once it sees "Franklin". A bidirectional model solves this issue.
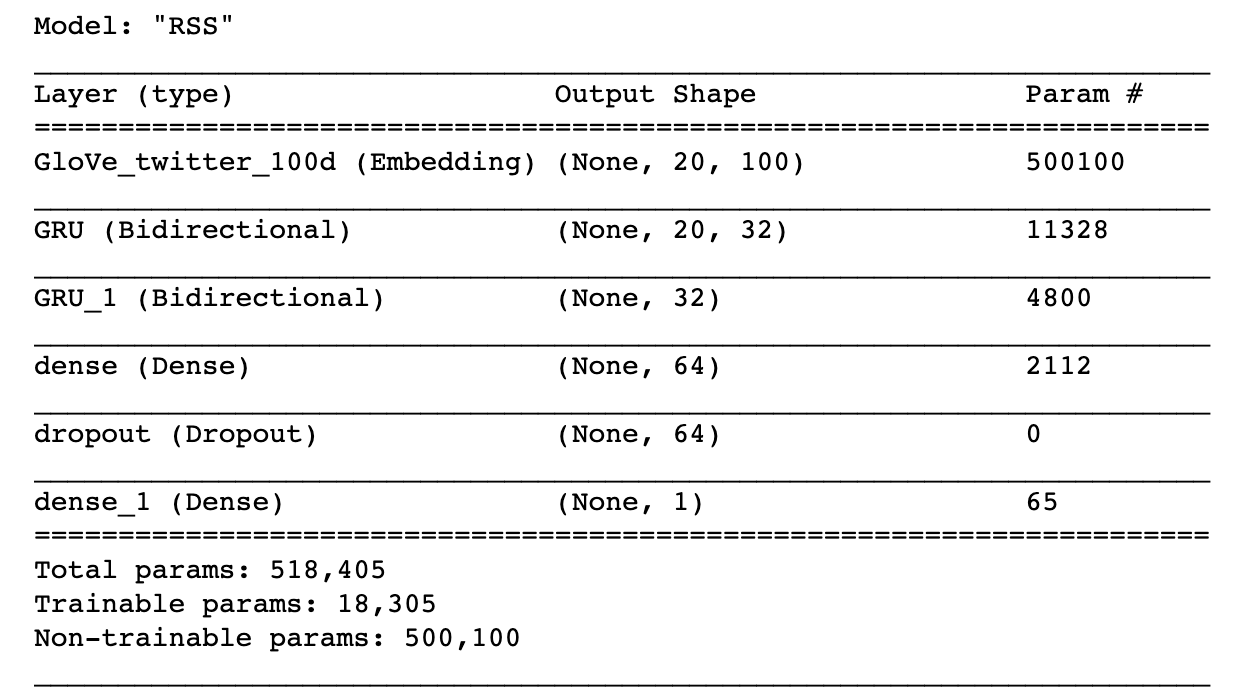
Model Structure
The model consists of:
- 100-dimensional frozen Embedding layer
- Two bidirectional GRU layers
- Dense layer with dropout
- Unactivated output layer
Transfer Learning
Other sentiment models are commonly trained on Amazon or IMDB ratings to allow an explicit text to score mapping, but this one is trained on Stanford NLP's Sentiment140 dataset, which contains 1.6 million tweets made in 2009 labeled for two-way polarity (either "positive" or "negative.") The paper "Sentiment Strength Detection in Short Informal Text" suggests that review datasets may be better suited for commercial applications, while internet messages have more in common with this exercise's use case. 2009 tweets and 2020 Reddit comments certainly have different distributions in terms of the range and connotation of words they use, especially given how most of the tweets have nothing to do with sports. This is where Transfer Learning comes in.
Because deep learning models are made of multiple layers, it's sometimes practical to transfer part of an existing model as a foundation for a new model. In this instance, I gave my model a headstart on learning semantic meanings of words by using GloVe embeddings from Stanford, which are trained on billions of examples. A model with stronger underlying semantic knowledge of will also be more robust when applied across text datasets with differing distributions.
Is This Model Predictive?
This model is explanatory rather than predictive, although a model predicting how fans' sentiment will change in the future could conceivably be trained on the outputs of thismodel. I plan to make this sentiment data available on GitHub for others to analyze in the near future.
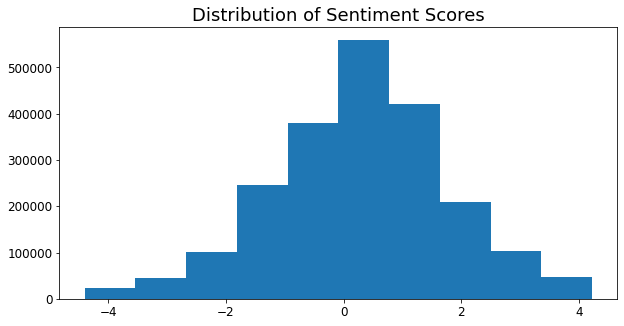
What Do Sentiment Scores Mean?
In probability models, the last layer of a model typically contains a formula that constricts values to a range from 0 to 1. In this case, I bypassed this step, allowing outputs for individual comments to range from roughly -4 to +4. Averages of all comments in a respective subreddit range from roughly +0.250 to +0.500. I find this range more intuitive than the corresponding probabilities of 57% and 62% positive; recall that no comment is completely positive or negative, but that the reality is a subjective spectrum. This is similar to the "sentiment strengths" technique from the aforementioned Short Informal Text paper, although the methodology differs.
Examples of Negative Sentiment:
- Ouch. :/ feels bad man (-4.09)
- Man pascal is missing 3s BADLY. those aren’t good misses (-3.92)
- The NBA and ESPN cannot foul out Giannis. The fix is in. (-2.40)
- we need mcdermott and j holiday to start making some shots it’s been rough the past few games (-1.34)
- True, but it was especially stupid for the Marlins to play yesterday. (-0.80)
- I’m chill with a minutes restriction. But 15 minutes?!? Ridiculous. I don’t even think that’s a good idea medically speaking, unless he’s on a bike during all his extended breaks. (-0.45)
Examples of Positive Sentiment:
- And with Brady at QB they could always add another DB to the field because of the lack of run threat. Now teams are going to have to put another guy in the box or else even a hobbled newton would feast. Should open up the passing game quite a bit (+0.40)
- Don’t mind me, just here for the salt. (+0.76)
- That and hearing the guys chirping has been my favorite part (+1.53)
- They streamed that game on YT over the summer and the amount of talent on both sides was incredible (+2.27)
- Very cool name IMO. Highlights the role of Native Americans in winning WW2. (+3.64)
- Thank you! It’s in my Tinder bio now, I’m so proud of it! (+4.07)
How Are the Graph "Averages" Calculated?
There's no hard-and-fast cutoff to what comments are recent, and thus relevant to fans' current mood. There's also the matter of maintaining enough sample size to prevent an individual comment's score from skewing the average over time spans where there may be few comments.
To tackle this, I use a half-life moving average. With a half life of 6 hours (as used here), a comment from 7 hours ago receives half the weight of a comment made 1 hour ago. The same goes for 15 hours ago vs. 9 hours ago, and so on. This solves both the problem of recency and sample size, since 100 comments made several hours ago will still cumulatively outweigh 10 comments made in the last few minutes, but those comments from the last few minutes are still individually worth more than each comment from several hours ago.
Model Performance
There is no current way to test model accuracy in predicting sentiment on the Reddit dataset. However, we can observe a clear relationship between the way subreddit sentiment changes before and after wins vs. losses, in a technique known as diff-in-diff. Here, pre- and postgame sentiment is calculated from the average sentiment of comments in a subreddits 6 hours before and after a game, respectively. In-game comments are not included in this comparison. Win delta refers to the change in sentiment from pre- to post-win, and loss delta refers to the same quantity when considering losses.
This analysis was conducted separately on MLB and NBA data. The respective graphs below illustrate how most teams react positively to wins and negatively to losses, and how virtually all teams react more positively to wins than to losses.
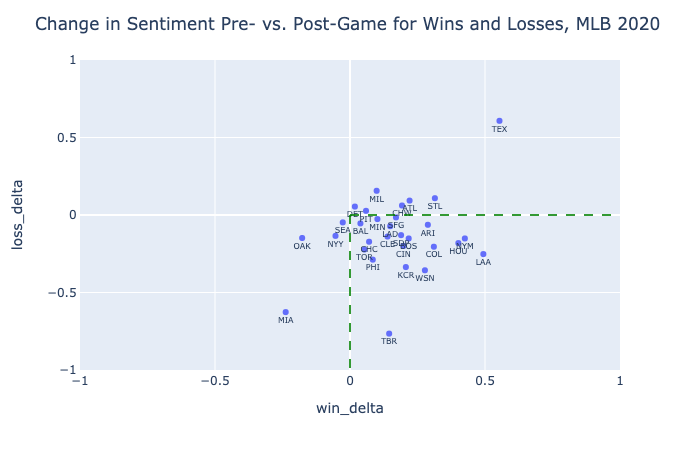
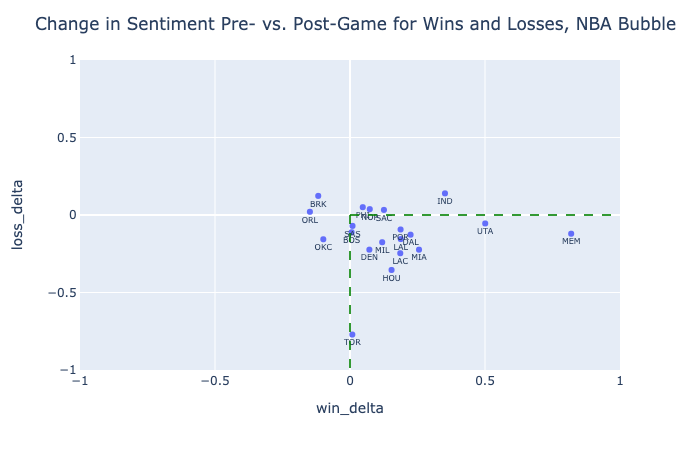
In terms of statistical significance, we can reject the null hypothesis that win delta is not greater than loss delta for the MLB with p < 0.0001 (using the comparison of means test). With a smaller slate of games, we still observe that p = 0.0001 for the NBA. These strong effects are an encouraging indicator of the model's ability to chart teams' seasons. With a larger sample size, future testing can be done to observe possible effects of clutch wins, blowouts, division leads, and news outside of the standings such as injuries and suspensions.
Can't the Model Just Look for "Win" and "Loss"?
While we should expect the model to glean positive sentiment from words "Win" or "Won", these words alone can't explain most of the gap in sentiment change in wins vs. losses. Within the MLB dataset, "Win," "Won," and similar variations are used in 10.4% of comments post-win. They're also used in 10.0% of comments post-loss. Variations around "Lose" and "Loss" are used in 4.0% of comments post-loss, and 2.6% of comments post-win. Even if the model hyper-focused on these words, it would only account for a roughly 1.8% change in sentiment probability in the positive or negative direction, which corresponds to a sentiment score change of .070. The average observed win-loss delta in the MLB is 0.285, or four times that.
Updates
- 8/23/20: Embeddings have been expanded by incorporating OOV (out-of-vocabulary) terms commonly seen in the Reddit sports communities but not included in the original GloVe embeddings. The model has been retrained to 81.3% test accuracy and consequently, sentiment score averages have declined slightly, with more team averages now dipping into the negatives.
Known Issues
- Not all subreddit comments in the observed timespan are in the dataset. This is due to the nature of the comment parsing script, as it will mark threads as "read" after a single pass, despite the potential for additional comments on that thread after the parsing. This is done to reduce comment parsing time by upwards of 90%, and data gaps can be mitigated by running the parsing script in the morning, when potentially busy threads are less likely to have just been created. Still, this issue is the cause for some apparent dips in comment activity during games.
- NHL game results do not currently appear in team graphs.
- Doubleheader game times may appear blurred together in graphs, due to an issue with Baseball Reference marking the start times as being 30 minutes apart.
- Suspended games are marked as if they were completed on graphs.
Tools Used
Icons made by iconixar from www.flaticon.com